Dear ImGui Bundle includes two powerful plotting libraries for 2D and 3D visualization.
ImPlot - 2D Plotting
Introduction
ImPlot adds interactive 2D plots to your GUI: line charts, bar charts, scatter plots, heatmaps, and more. Plots support zooming, panning, and hover inspection.

Some of the many plot types supported by ImPlot.
Quick example:
from imgui_bundle import implot, immapp
import numpy as np

x = np.arange(0, 10, 0.1)
y = np.sin(x)

def gui():
    if implot.begin_plot("My Plot"):
        implot.plot_line("sin(x)", x, y)
        implot.end_plot()

immapp.run(gui, with_implot=True)#include "immapp/immapp.h"
#include "implot/implot.h"
#include <cmath>
#include <vector>
std::vector<double> x, y;
void gui() {
if (ImPlot::BeginPlot("My Plot")) {
ImPlot::PlotLine("sin(x)", x.data(), y.data(), x.size());
ImPlot::EndPlot();
}
}
int main() {
for (double i = 0; i < 10; i += 0.1) {
x.push_back(i);
y.push_back(std::sin(i));
}
HelloImGui::RunnerParams runner_params;
runner_params.callbacks.ShowGui = gui;
ImmApp::AddOnsParams addons;
addons.withImplot = true;
ImmApp::Run(runner_params, addons);
return 0;
}Python: context managers (implot_ctx)
In Python, implot_ctx provides context managers that pair each
implot.begin_*() / push_*() call with its matching end_*() / pop_*():
from imgui_bundle import implot, implot_ctx, immapp
import numpy as np

x = np.arange(0, 10, 0.1)
y = np.sin(x)

def gui():
    with implot_ctx.begin_plot("My Plot") as plot:
        if plot:  # the plot may be collapsed or clipped: always test it
            implot.plot_line("sin(x)", x, y)

immapp.run(gui, with_implot=True)
implot_ctx.begin_plot and begin_subplots return an object that must be
truth-tested before drawing. The push_* context managers
(push_style_color, push_style_var, push_colormap, push_plot_clip_rect)
need no test: they simply pop automatically.
Full Demo
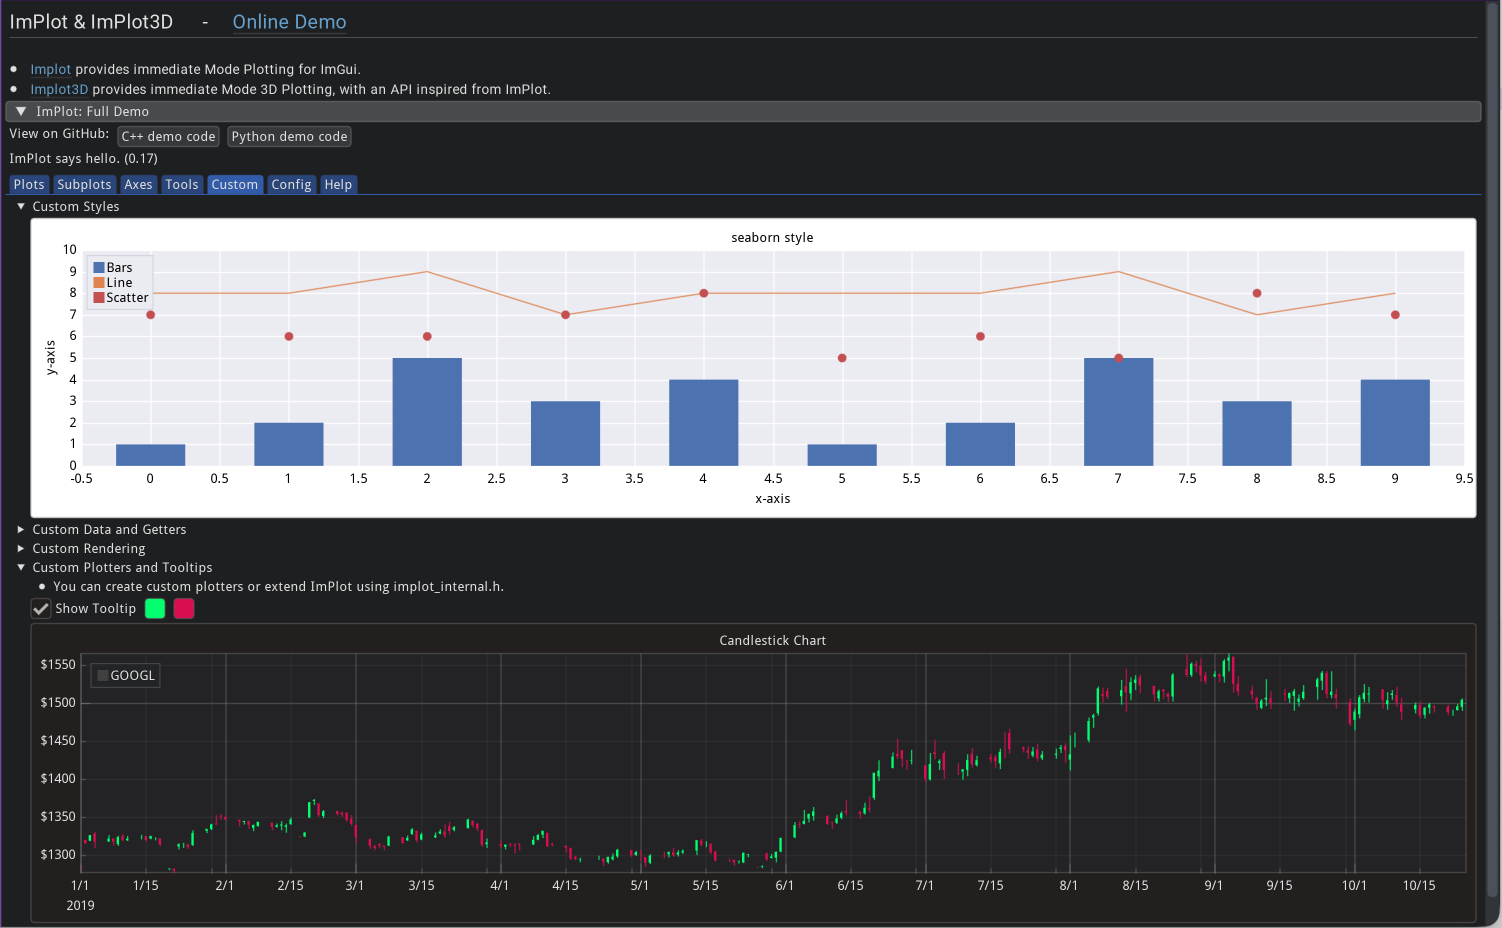
ImPlot demo showcasing various plot types and features.
Try online: the explorer shows each demo running side by side with its code (Python or C++), so it can be used as a reference when writing your own plots.
Python demo code: implot_demo.py
C++ demo code: implot_demo.cpp
Documented APIs
Python API reference: implot/__init__.pyi
C++ API reference: implot.h
ImPlot3D - 3D Plotting
Introduction
ImPlot3D extends ImPlot with 3D visualization capabilities. Create interactive 3D line plots, scatter plots, surface plots, and more with rotation, zoom, and pan controls.

Some of the plot types supported by ImPlot3D.
Quick example:
from imgui_bundle import implot3d, immapp, hello_imgui
import numpy as np

t = np.linspace(0, 10, 100)
x, y, z = np.cos(t), np.sin(t), t

def gui():
    if implot3d.begin_plot("3D Helix", hello_imgui.em_to_vec2(30, 30)):
        implot3d.setup_axes("X", "Y", "Z")
        implot3d.plot_line("helix", x, y, z)
        implot3d.end_plot()

immapp.run(gui, with_implot3d=True)#include "immapp/immapp.h"
#include "implot3d/implot3d.h"
#include <vector>
#include <cmath>
std::vector<double> x, y, z;
void gui() {
if (ImPlot3D::BeginPlot("3D Helix")) {
ImPlot3D::SetupAxes("X", "Y", "Z");
ImPlot3D::PlotLine("helix", x.data(), y.data(), z.data(), x.size());
ImPlot3D::EndPlot();
}
}
int main() {
for (double t = 0; t < 10; t += 0.1) {
x.push_back(std::cos(t));
y.push_back(std::sin(t));
z.push_back(t);
}
HelloImGui::RunnerParams runner_params;
runner_params.callbacks.ShowGui = gui;
ImmApp::AddOnsParams addons;
addons.withImplot3d = true;
ImmApp::Run(runner_params, addons);
return 0;
}Full Demo
The full demo for ImPlot3D is available online.
Python demo code: implot3d_demo.py
C++ demo code: implot3d_demo.cpp
Documented APIs
Python API reference: implot3d
/ _ _init _ _ .pyi C++ API reference: implot3d.h